Break-even Charts (CIE IGCSE Business)

Revision Note

Danielle Maguire

Expertise

Business Content Creator

An Introduction to Break-even

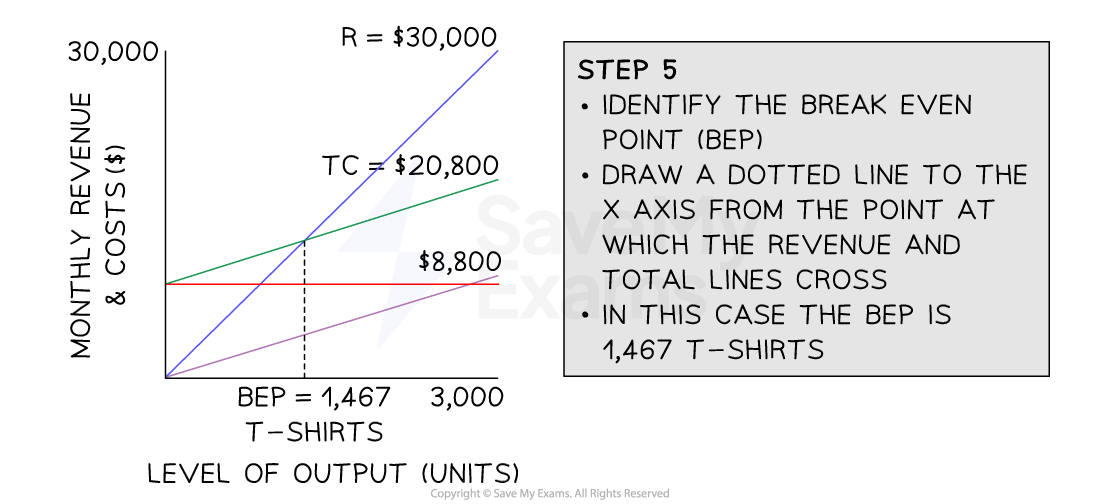
  • Break-even analysis is a financial tool used to determine the number of units a business must sell to reach the point where the business revenue equals its expenses (no profit nor loss)
    • It helps businesses understand the minimum level of sales or output they need to achieve in order to cover all costs
    • This helps business managers to make informed decisions about pricing and production volumes
       
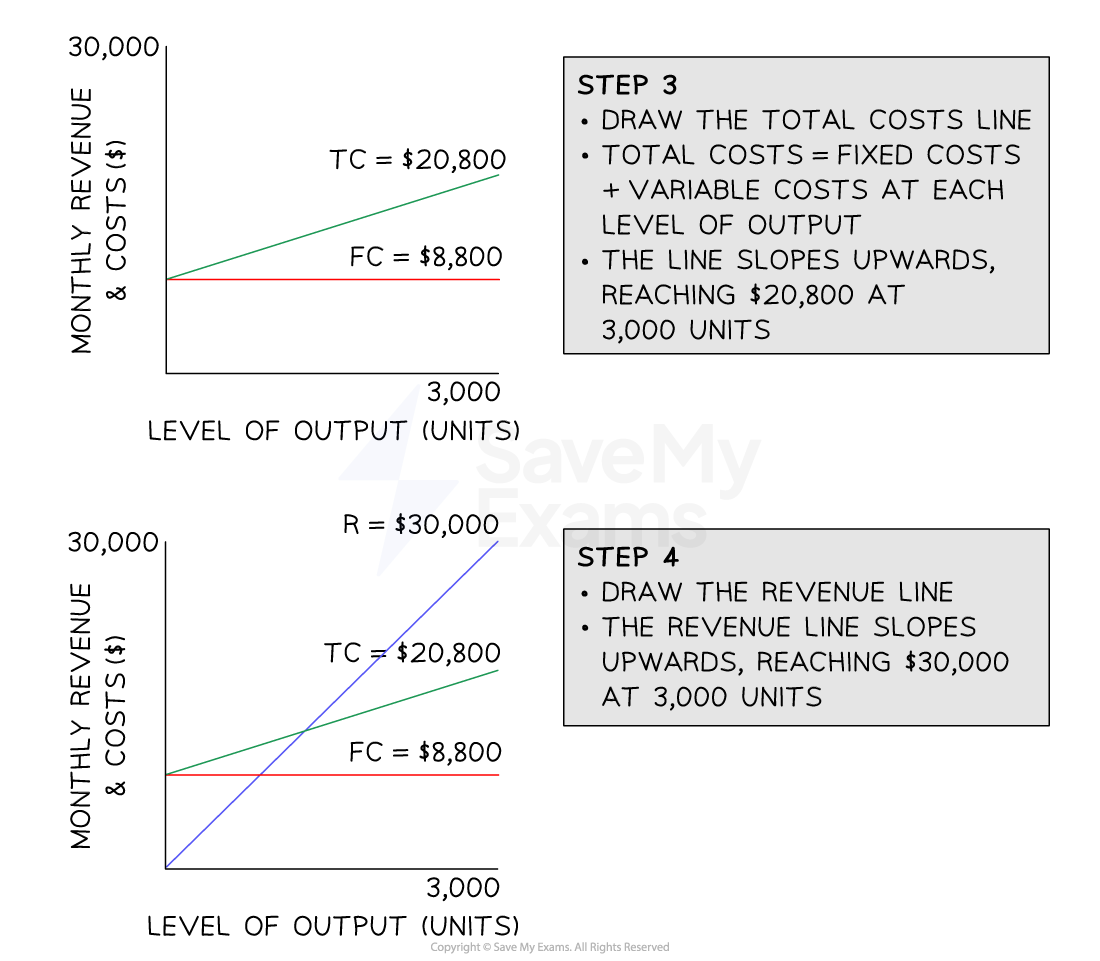
  • The break-even point is the number of units that need to be sold for total costs to equal the sales revenue

Diagram with the Elements of a Break-even Analysis

Diagram with the Three main Components of a Break-even Analysis

Variable costs, fixed costs and sales revenue are all used in calculating the break-even point
 

  • Fixed costs are costs that do not change regardless of the level of production or sales
    • E.g. rent, salaries and insurance
       
  • Variable costs are costs that vary with the level of production or sales
    • E.g. raw materials, direct labour costs, packaging and shipping costs
       
  • Sales revenue is the money gained from selling products/service and is calculated as follows
    • Sales revenue = number of items sold x selling price

Constructing a Break-even Chart

  • Break-even charts are graphs which show how costs and revenues of a business change with sales
    • It identifies the number of units a business must sell in order to break-even

  • In order to construct a break-even chart the business needs to know the estimated fixed costs, variable costs and sales revenue

Break-even Table of Costs and Revenue for Tee-Crazy Ltd

  Sales $ = 0 units Sales $ = 500 units Sales $ = 3000 units
Fixed Costs 8,800

8,800

8,800

Variable Costs 0

2,000

12,000

Total Costs 8,800

10,800

20,800

Total Revenue 0

5,000

30,000


  • Tee Crazy Ltd has the following estimates
    •  Fixed costs are $8,800 per year
    • The variable costs of each t-shirt is $4
    • Each t-shirt is sold for a price of $10
    • The factory can produce a maximum output of 3000 t-shirts per year 

Diagram of how to Construct a Break-even Chart

constructing-a-break-even-chart-1-1

constructing-a-break-even-chart-2

constructing-a-break-even-chart-3

Five steps to constructing the perfect break-even chart
 

  • Production output below the break-even point results in the business making a loss
    • Production output above the break-even point results in a profit

Interpreting a Break-even Chart

  • A break even chart is a visual representation of the break-even point and is used to identify several key metrics
    • The break-even point
    • The margin of safety
    • The expected profit or loss 

Diagram of a Break-even Chart

2-2-3-interpretation-of-break-even-charts

The break-even chart for A2B Limited shows that at 324 units the total revenue = the total costs
  

Diagram analysis 

  • Fixed costs do not change as output increases
    • A2B's fixed costs are £8,000 and these do not change whether the business produces 0 units or 500 units
       
  • Total costs are made up of fixed and variable costs
    • At 0 units of output, they are made up exclusively of fixed costs
    • At 500 units the total variable costs equate to £11,800
    • This line slopes upwards because total variable costs increase as output increases
       
  • The revenue line also slopes upwards
    • At 0 units of output, the revenue is £0
    • At 500 units the total revenue equates to £11,800
    • Revenue will increase with the output
    • The line will slope more steeply than the total costs and will cross the total costs line at some point
       
  • The point at which the total costs and the revenue lines cross is the break even point
    • The break even level of output for A2B is 324 units

  • The margin of safety can be identified as the difference on the x-axis between the actual level of output (in this case 450 units) and the break even point (300 units). The margin of safety is 150 units

  • The profit made at a specific level of output can be identified as the space between the revenue and total costs lines
    • In this instance, the profit made at 450 units of output is £14,400 - £11,250 = £3,150

Exam Tip

When calculating the break-even point write down the break-even formula first and then find the figures you need to fill in the data required.

This allows you to check that you have everything you need for the calculation. You will be able to identify very quickly whether you need to carry out further calculations such as total fixed costs.

You've read 0 of your 0 free revision notes

Get unlimited access

to absolutely everything:

  • Downloadable PDFs
  • Unlimited Revision Notes
  • Topic Questions
  • Past Papers
  • Model Answers
  • Videos (Maths and Science)

Join the 100,000+ Students that ❤️ Save My Exams

the (exam) results speak for themselves:

Did this page help you?

Danielle Maguire

Author: Danielle Maguire

Danielle is an experienced Business and Economics teacher who has taught GCSE, A-Level, BTEC and IB for 15 years. Danielle's career has taken her from across various parts of the UK including Liverpool and Yorkshire, along with teaching at a renowned international school in Dubai for 3 years. Danielle loves to engage students with real life examples and creative resources which allow students to put topics in a context they understand.