1. Analysing markets in joint demand
- Changes to the price of one good shift the entire demand curve of a complementary good
Diagram: Markets for Mobiles & Mobile Apps
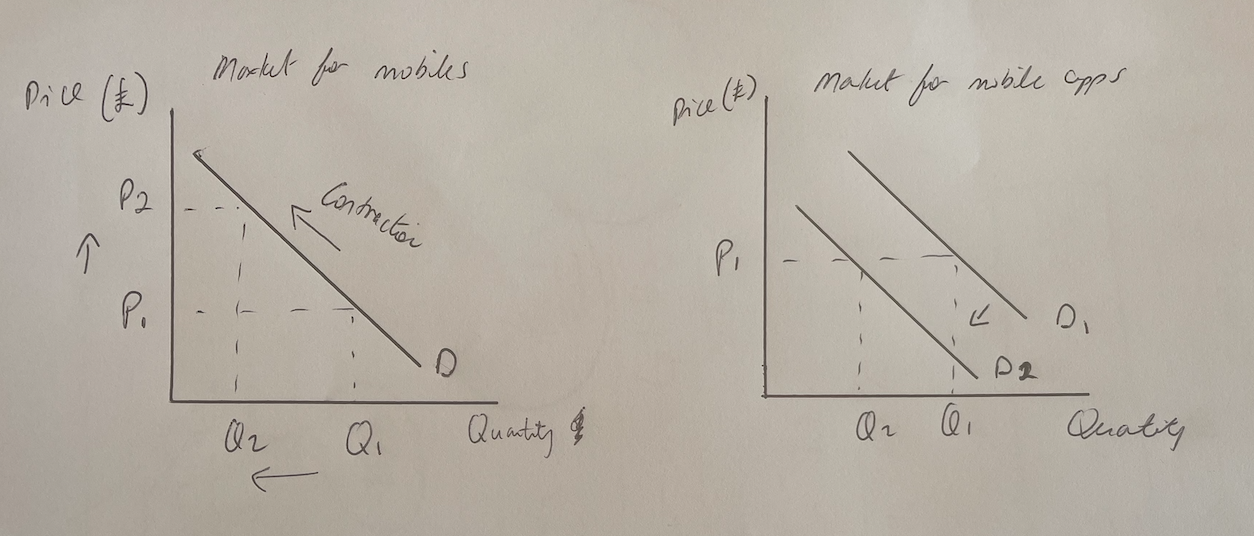
Increases in price of mobile phones, shift the entire demand curve of mobile apps to the left
Diagram analysis
Market for mobiles
- An increase in price for mobiles from P1→P2 leads to a movement up the demand curve
- Due to the increase in price, there is a contraction in QD from Q1→Q2
Market for mobile apps
- As a result of price increase for mobile phones, there will be an decrease in demand for mobile apps (the complementary good) as more consumers become buy less
- This causes a shift in demand from D1 to D2. The price remains unchanged at P1 but the demand has decreased from Q1→Q2
2. Analysing markets in joint supply
- As the production of beef increases, the supply of leather will increase (as it is a by-product of beef)
Diagram: Market for Beef & Leather

An increase in demand for beef increases the the supply of leather
Diagram analysis
Market for beef
- If the real income of individuals of a country increase, there may be an increase in demand for beef (considered a normal good)
- This causes a shift in demand from D1 → D2. The price has increased from P1 → P2 and the quantity has increased from Q1 → Q2
Market for leather
- When there is an increase of quantity of beef, there will be an increase in the supply of leather
- This is a shift in supply from S1 to S2. The price increased from P1 → P2 and the supply has decreased from Q1 → Q2