Speed-Time Graphs (Cambridge O Level Physics)
Revision Note

Author
AshikaExpertise
Physics Project Lead
Speed-Time Graphs
- A speed-time graph shows how the speed of a moving object varies with time
- The red line represents an object with increasing speed
- The green line represents an object with decreasing speed
Increasing and decreasing speed

Increasing and decreasing speed represented on a speed-time graph
Acceleration on a Speed-Time Graph
- Speed-time graphs also show the following information:
- If the object is moving with a constant acceleration or deceleration
- The magnitude of the acceleration or deceleration
- A straight line represents constant acceleration
- The slope of the line represents the magnitude of acceleration
- A steep slope means large acceleration (or deceleration) - i.e. the object's speed changes very quickly
- A gentle slope means small acceleration (or deceleration) - i.e. the object's speed changes very gradually
- A flat line means the acceleration is zero - i.e. the object is moving with a constant speed
Acceleration, deceleration and constant speed

This image shows how to interpret the slope of a speed-time graph
Using Speed-Time Graphs
- The distance travelled by an object can be found by determining the area beneath the graph
Area under a velocity-time graph
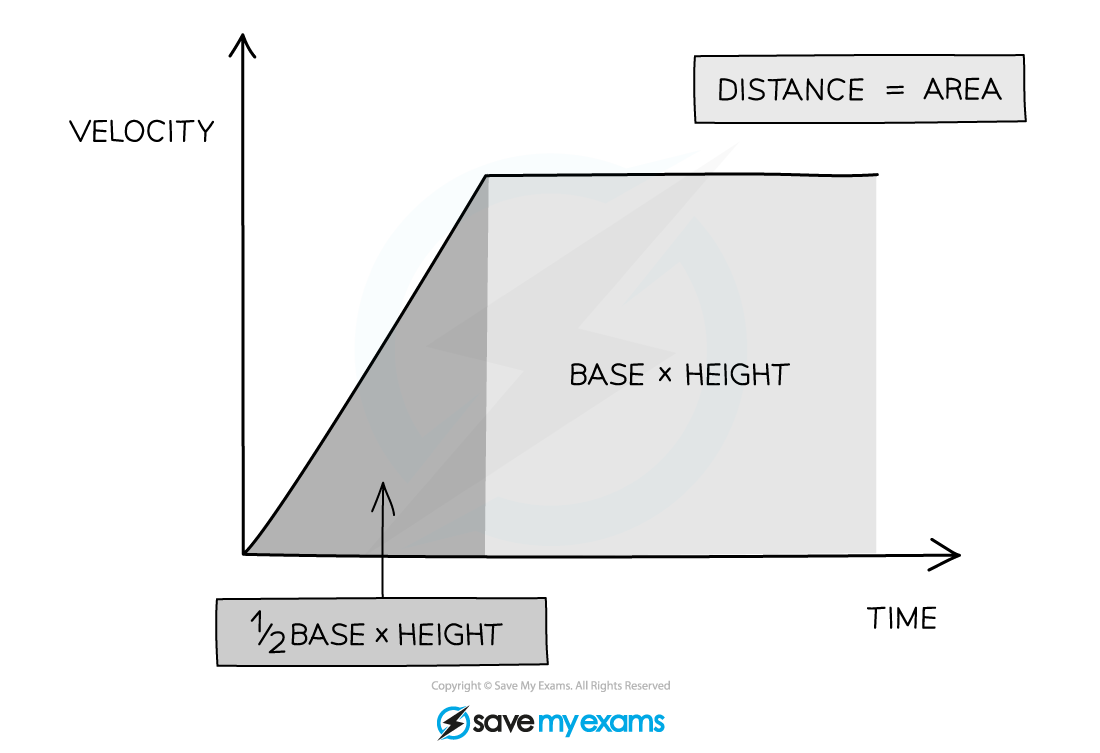
The distance travelled can be found from the area beneath the graph
- If the area beneath the graph forms a triangle (the object is accelerating or decelerating) then the area can be determined using the formula:
format('truetype')%3Bfont-weight%3Anormal%3Bfont-style%3Anormal%3B%7D%3C%2Fstyle%3E%3C%2Fdefs%3E%3Ctext%20font-family%3D%22Times%20New%20Roman%22%20font-size%3D%2218%22%20text-anchor%3D%22middle%22%20x%3D%2215.5%22%20y%3D%2230%22%3Earea%3C%2Ftext%3E%3Ctext%20font-family%3D%22math102a87acd26f5771b4d57a7dfb3%22%20font-size%3D%2216%22%20text-anchor%3D%22middle%22%20x%3D%2242.5%22%20y%3D%2230%22%3E%3D%3C%2Ftext%3E%3Cline%20stroke%3D%22%23000000%22%20stroke-linecap%3D%22square%22%20stroke-width%3D%221%22%20x1%3D%2257.5%22%20x2%3D%2269.5%22%20y1%3D%2223.5%22%20y2%3D%2223.5%22%2F%3E%3Ctext%20font-family%3D%22Times%20New%20Roman%22%20font-size%3D%2218%22%20text-anchor%3D%22middle%22%20x%3D%2263.5%22%20y%3D%2216%22%3E1%3C%2Ftext%3E%3Ctext%20font-family%3D%22Times%20New%20Roman%22%20font-size%3D%2218%22%20text-anchor%3D%22middle%22%20x%3D%2263.5%22%20y%3D%2241%22%3E2%3C%2Ftext%3E%3Ctext%20font-family%3D%22math102a87acd26f5771b4d57a7dfb3%22%20font-size%3D%2216%22%20text-anchor%3D%22middle%22%20x%3D%2280.5%22%20y%3D%2230%22%3E%26%23xD7%3B%3C%2Ftext%3E%3Ctext%20font-family%3D%22Times%20New%20Roman%22%20font-size%3D%2218%22%20text-anchor%3D%22middle%22%20x%3D%22109.5%22%20y%3D%2230%22%3Ebase%3C%2Ftext%3E%3Ctext%20font-family%3D%22math102a87acd26f5771b4d57a7dfb3%22%20font-size%3D%2216%22%20text-anchor%3D%22middle%22%20x%3D%22137.5%22%20y%3D%2230%22%3E%26%23xD7%3B%3C%2Ftext%3E%3Ctext%20font-family%3D%22Times%20New%20Roman%22%20font-size%3D%2218%22%20text-anchor%3D%22middle%22%20x%3D%22172.5%22%20y%3D%2230%22%3Eheight%3C%2Ftext%3E%3C%2Fsvg%3E)
- If the area beneath the graph is a rectangle (constant velocity) then the area can be determined using the formula:
format('truetype')%3Bfont-weight%3Anormal%3Bfont-style%3Anormal%3B%7D%3C%2Fstyle%3E%3C%2Fdefs%3E%3Ctext%20font-family%3D%22Times%20New%20Roman%22%20font-size%3D%2218%22%20text-anchor%3D%22middle%22%20x%3D%2215.5%22%20y%3D%2216%22%3Earea%3C%2Ftext%3E%3Ctext%20font-family%3D%22math102a87acd26f5771b4d57a7dfb3%22%20font-size%3D%2216%22%20text-anchor%3D%22middle%22%20x%3D%2242.5%22%20y%3D%2216%22%3E%3D%3C%2Ftext%3E%3Ctext%20font-family%3D%22Times%20New%20Roman%22%20font-size%3D%2218%22%20text-anchor%3D%22middle%22%20x%3D%2271.5%22%20y%3D%2216%22%3Ebase%3C%2Ftext%3E%3Ctext%20font-family%3D%22math102a87acd26f5771b4d57a7dfb3%22%20font-size%3D%2216%22%20text-anchor%3D%22middle%22%20x%3D%2299.5%22%20y%3D%2216%22%3E%26%23xD7%3B%3C%2Ftext%3E%3Ctext%20font-family%3D%22Times%20New%20Roman%22%20font-size%3D%2218%22%20text-anchor%3D%22middle%22%20x%3D%22134.5%22%20y%3D%2216%22%3Eheight%3C%2Ftext%3E%3C%2Fsvg%3E)
Worked example
The speed-time graph below shows a car journey which lasts for 160 seconds.

Calculate the total distance travelled by the car on this journey.
Answer:
Step 1: Recall that the area under a velocity-time graph represents the distance travelled
- In order to calculate the total distance travelled, the total area underneath the line must be determined
Step 2: Identify each enclosed area
- In this example, there are five enclosed areas under the line
- These can be labelled as areas 1, 2, 3, 4 and 5, as shown in the image below:

Step 3: Calculate the area of each enclosed shape under the line
- Area 1 = area of a triangle = ½ × base × height = ½ × 40 × 17.5 = 350 m
- Area 2 = area of a rectangle = base × height = 30 × 17.5 = 525 m
- Area 3 = area of a triangle = ½ × base × height = ½ × 20 × 7.5 = 75 m
- Area 4 = area of a rectangle = base × height = 20 × 17.5 = 350 m
- Area 5 = area of a triangle = ½ × base × height = ½ × 70 × 25 = 875 m
Step 4: Calculate the total distance travelled by finding the total area under the line
- Add up each of the five areas enclosed:
total distance = 350 + 525 + 75 + 350 + 875
total distance = 2175 m

You've read 0 of your 0 free revision notes
Get unlimited access
to absolutely everything:
- Downloadable PDFs
- Unlimited Revision Notes
- Topic Questions
- Past Papers
- Model Answers
- Videos (Maths and Science)
Did this page help you?