
Tectonic Hazard Trends Since 1960
Global disaster trends
- The number of recorded disasters has increased significantly since 1960
- There are a number of reasons for this including:
- Increased population - the world population has grown from 3 billion to over 8 billion since 1960
- This means more people are likely to be impacted by any hazard event
- Increased population density in urban and coastal areas increases the vulnerable population
- Increased monitoring and reporting means more hazard events are recorded
- Increased population - the world population has grown from 3 billion to over 8 billion since 1960
- Most of the increase has been the result of floods and extreme weather

Recorded global disasters 1900-2022
Tectonic disaster trends
- The number of tectonic disasters has fluctuated since 1960 but has generally remained steady
- The slight increase in a number of earthquake disasters does not mean there have been more earthquakes or higher magnitude earthquakes. It results from:
- Greater urbanisation leads to higher population densities and increased building density
- Population growth means more people are living in earthquake-prone regions

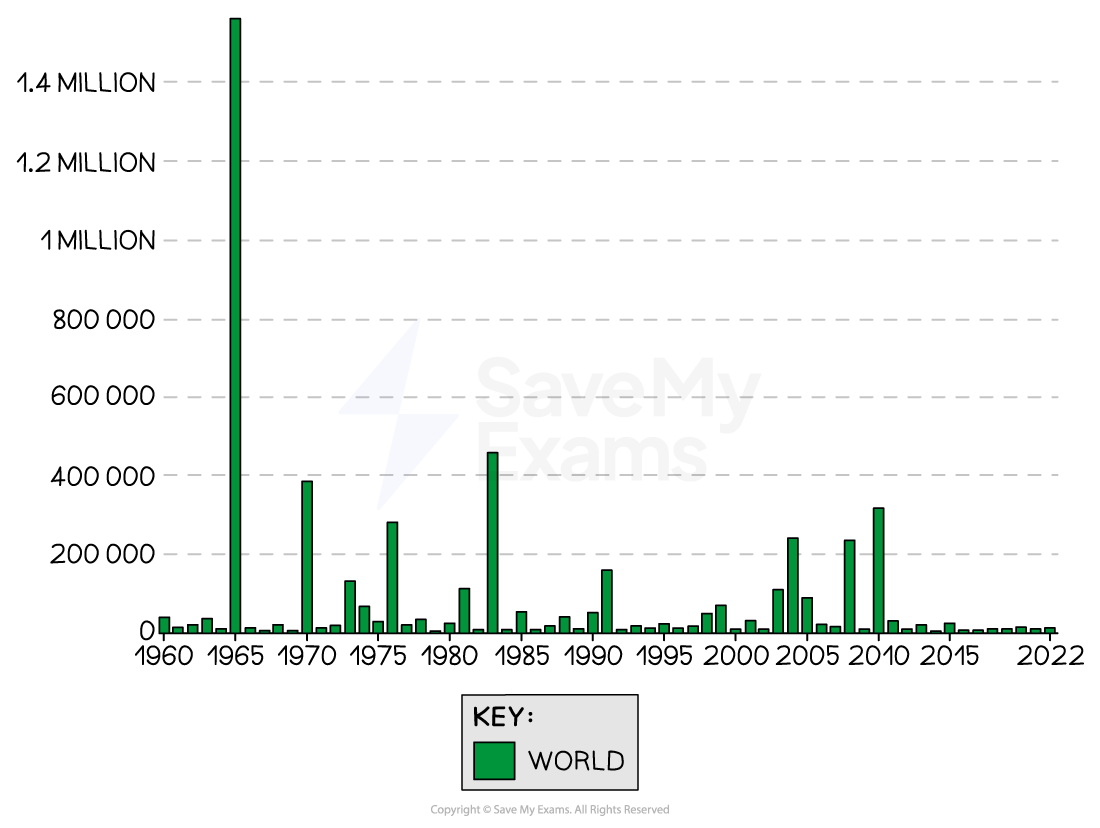
Global tectonic disasters 1900-2022
Number of deaths
- The number of deaths resulting from all hazards has decreased since 1960
- This is the result of:
- Improved building construction, design and materials
- Increased monitoring
- Greater preparation and planning - hazard mapping, land use zoning, evacuation planning
- Education - earthquake drills
- Improved warning systems
- Increased development
Number of deaths from disasters
- The number of deaths from tectonic hazards fluctuates depending on a range of factors including:
- Magnitude
- Level of development
- Location

1900 1910 1920 1930 1940 1950 1960 1970 1980 1990 2000 2010 2020
Deaths resulting from tectonic activity
- The impact of a mega-disaster such as the Indian Ocean earthquake and tsunami may skew the overall trend because it leads to so many deaths
- Volcanic eruptions are less frequent than earthquakes and deaths from eruptions are now rare due to improved monitoring, exclusion zones and evacuation plans
Economic cost trends
- The economic cost of disasters has increased since 1960
- As countries develop the cost of repairing infrastructure and rebuilding increases
- Increased wealth means people have more possessions and property to be damaged and destroyed
- Infrastructure is more sophisticated and expensive to replace, for example, electric grids
- As more people are affected the cost increases
- As countries develop the cost of repairing infrastructure and rebuilding increases
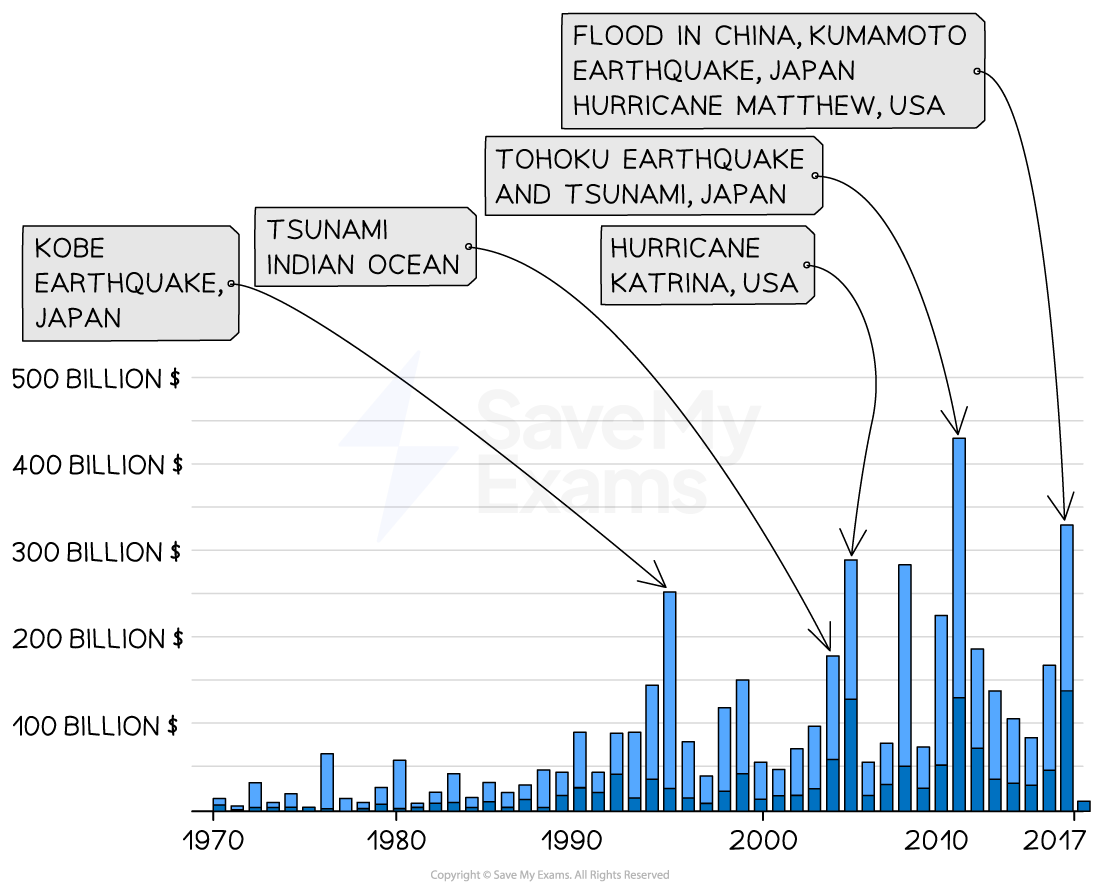
Changes in the global economic cost of disasters
- The economic impact of disasters is affected by whether the country is developing (LIC) or developed (HIC)
- The economic cost in US$ tends to be higher in developed countries
- The impact on the GDP tends to be much greater in developing and emerging countries
Comparison of Costs LIC Vs HIC
| Event | Estimated cost (US$) | % GDP |
| Gorkha earthquake, Nepal (2015) | 10 billion | 33% |
| Tohoku earthquake and tsunami, Japan (2011) | 360 billion | 4% |
Accuracy and reliability of data
- The trends associated with all disasters are complex
- They are affected by a wide range of factors
- When disasters occur the data collected may not be accurate due to:
- The focus when a disaster strikes and in the weeks that follow is on search, rescue and recovery
- In remote rural areas it may be difficult to collect data
