Price Level: Inflation (AQA A Level Economics)

Revision Note

Test Yourself
Lorraine Clancy

Expertise

Economics Content Creator

Inflation, Deflation & Disinflation

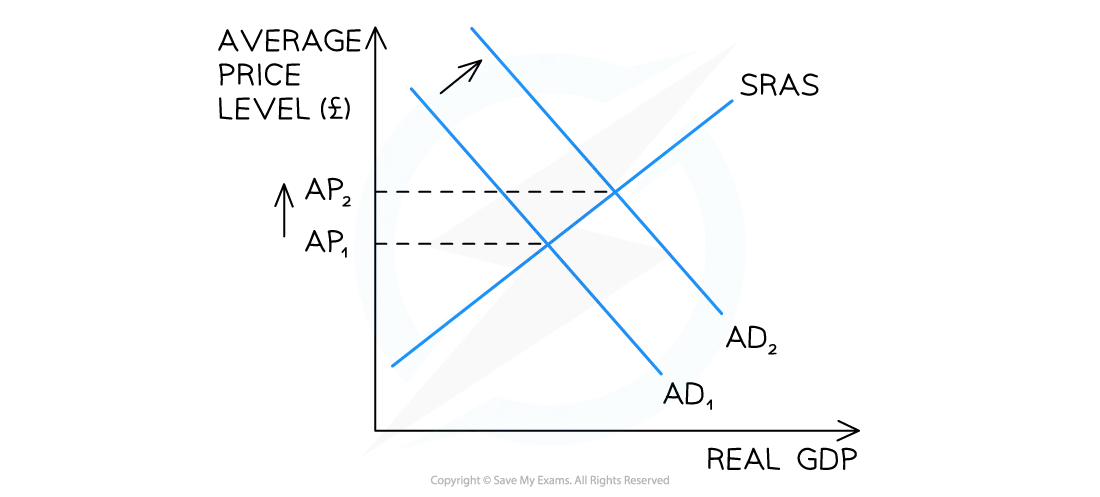
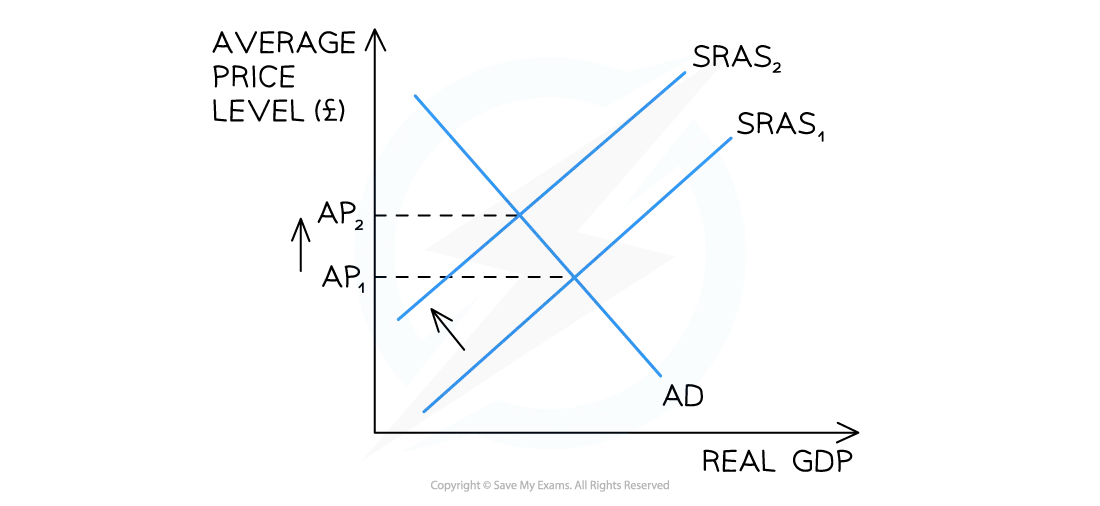
  • Inflation is the sustained increase in the average price level of goods/services in an economy  
  • Deflation occurs when there is a fall in the average price level of goods/services in an economy
    • Deflation only occurs when the percentage change in prices falls below zero %
  • Disinflation occurs when the average price level increases but at a decreasing rate than before
    • These figures demonstrate disinflation:  Y1 = 5%  Y2 = 4%  Y3 = 2%

Diagram: UK Inflation, Disinflation and Deflation

2-1-2-inflation---worked-example_edexcel-al-economics

Between 2013 and 2015, the UK experienced disinflation, with inflation falling from 3.5% to just on 0%. From 2021, it experienced sustained inflation, rising to 4.2%

Causes of Inflation

  • An increase in the average prices in an economy can be caused by demand pull inflation or cost push inflation

1. Demand pull inflation

  • Demand pull inflation is caused by excess demand in the economy
  • Aggregate demand (AD) is the sum of all expenditure in the economy
    • AD = Consumption (C) + Investment (I) + Government spending (G) + Net Exports (X-M)

Diagram: Demand Pull Inflation

Diagram of an increase in aggregate demand ad raises the average price level in an economy-leading to demand pull inflation for A level Economics

An increase in aggregate demand (AD) raises the average price level in an economy 

Diagram analysis

  • If any of the four components of AD increase, there will be a shift to the right of the AD curve from AD1 → AD2
  • At the original price (AP1), there is now a condition of excess demand in the economy (extend the dotted line across until it hits the new demand curve to identify the excess demand)
  • Prices for goods/services are bid up from AP1 → AP2
  • Demand pull inflation has occurred
  • If the Central Bank lowers the base rate, there is likely to be increased borrowing by firms and consumers
    • This will result in an increase in consumption and investment
    • It is likely to lead to a form of demand-pull inflation

2. Cost push inflation

  • Cost push inflation is caused by increases in the costs of production in an economy

Diagram: Cost Push Inflation

Diagram of cost push inflation for A level Economics

An increase in the costs of production raises the average price level in an economy, leading to cost push inflation 

Diagram analysis

  • If any of the costs of production increase (labour, raw materials etc.), or if there is a fall in productivity, there will be a shift to the left of the SRAS curve from SRAS1→SRAS2
  • At the original price (AP1), there is now a condition of excess demand in the economy
  • As prices rise, there is a contraction of AD and an extension of SRAS
  • Prices for goods/services are bid up from AP1→AP2
  • Cost push inflation has occurred

The Quantity Theory of Money

  • The Monetarist model, strongly influenced by economists like Milton Friedman, believe that an increase in money supply can lead to inflation, while a decrease can result in deflation
  • Monetarists believe that central banks should focus on controlling the money supply to achieve price stability. They argue that a steady and predictable growth rate in the money supply can contribute to stable economic conditions

  • Fisher's equation of exchange MV = PQ and the Quantity Theory of Money is a key component of the monetarist model
    • Equation of exchange (MV = PQ)
      • M represents money supply in the economy
      • V signifies the velocity or speed at which money circulates in the economy. It measures how many times, on average, a unit of currency changes hands in a given time period
      • P represents the general price level of goods/services in the economy. It reflects the average prices of a basket of goods
      • Q stands for the real output or quantity of goods/services produced in the economy

  • All other things being equal, if the velocity of circulation is constant, the quantity theory of money based on Fisher’s equation of exchange, MV=PQ, predicts that an x% increase in the money supply will always cause an x% increase in nominal national income, i.e there will be inflation

The Relationship Between Expectations and Changes in the Price Level

  • Expectations refer to individuals' anticipations of future economic conditions
    • Often, if consumers expect prices to fall, they will delay purchases in the hope of purchasing good/services at lower prices
      • The delay in consumption then helps prices to fall!
    • Often, if consumers expect prices to rise, they will rush to purchase good/services at lower prices before they rise
      • The increase in consumption then helps prices to rise!

  • Inflation psychology refers to the psychological factors that influence how individuals and businesses anticipate and react to inflation

Types of Inflation Psychology

Adaptive Expectations

Rational Expectations

  • Adaptive expectations assume that individuals base their expectations on past observations and experiences
  • If consumers / investors have experienced high inflation in the past, they may expect it to continue and adjust their behaviour accordingly. This can lead to persistent inflationary pressures

  • Rational expectations assume that individuals form expectations based on all available information, including current and past data, and that these expectations are unbiased
  • Individuals are forward-looking and make decisions considering the most relevant and up-to-date information

The Consequences of Inflation

  • The consequences of inflation are different for different stakeholders in the economy
  • The consequences are also dependent on the household level of wealth and income
     

The Impact of Inflation on Different Stakeholders


Stakeholder


 Explanation of Impact

Firms

  • Rapid price changes create uncertainty and delay investment
  • Price changes force firms to change their menu prices too and this can be expensive

Consumers

  • Decrease in purchasing power
  • Decrease in the real value of savings (as money will be worth less in real terms)
  • Fall in real income for those on fixed incomes or pensions
  • Inflation is more harmful to low income households

Government

  • Inflation erodes international competitiveness of export industries as the country's exports are now relatively more expensive
  • Economic growth may slow due to a fall in exports and a possible fall in consumption
  • Trade-offs involved in tackling inflation, e.g reducing inflation may increase unemployment and/or reduce economic growth

Workers

  • Demand higher wages to compensate for reduced purchasing power
  • If wage increases ≠ inflation, motivation and productivity may fall

Exam Tip

When analysing inflation in data response questions, or evaluating it in longer essay questions, make certain that you consider the size of any inflation. Low inflation is not bad but is actually a sign of a healthy economy as it is indicative of economic growth.

You've read 0 of your 0 free revision notes

Get unlimited access

to absolutely everything:

  • Downloadable PDFs
  • Unlimited Revision Notes
  • Topic Questions
  • Past Papers
  • Model Answers
  • Videos (Maths and Science)

Join the 100,000+ Students that ❤️ Save My Exams

the (exam) results speak for themselves:

Did this page help you?

Lorraine Clancy

Author: Lorraine Clancy

Lorraine brings over 12 years of dedicated teaching experience to the realm of Leaving Cert and IBDP Economics. Having served as the Head of Department in both Dublin and Milan, Lorraine has demonstrated exceptional leadership skills and a commitment to academic excellence. Lorraine has extended her expertise to private tuition, positively impacting students across Ireland. Lorraine stands out for her innovative teaching methods, often incorporating graphic organisers and technology to create dynamic and engaging classroom environments.