Short-run & Long-run Relationships (AQA A Level Economics)

Revision Note

Test Yourself
Steve Vorster

Expertise

Economics & Business Subject Lead

Short-run and Long-run Average Costs Curves

  • Day to day operations of a firm occur in the short-run
  • In the long-run, they are able to plan to increase the scale of production
    • E.g by increasing the size of the factory
    • Larger scale = more output & the firm moves onto a new SRAC curve in which the average unit costs are lower

  • In the long-run, a growing firm is likely to keep repeating this process,
    • Each time a more efficient SRAC is generated

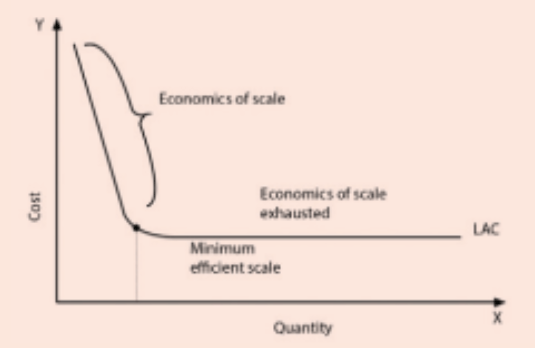
  • The long-run average cost curve (LRAC) is the line of best fit between the lowest points of the short-run ATC curves

3-3-2-sr-_-lr-average--cost-curves_edexcel-al-economics

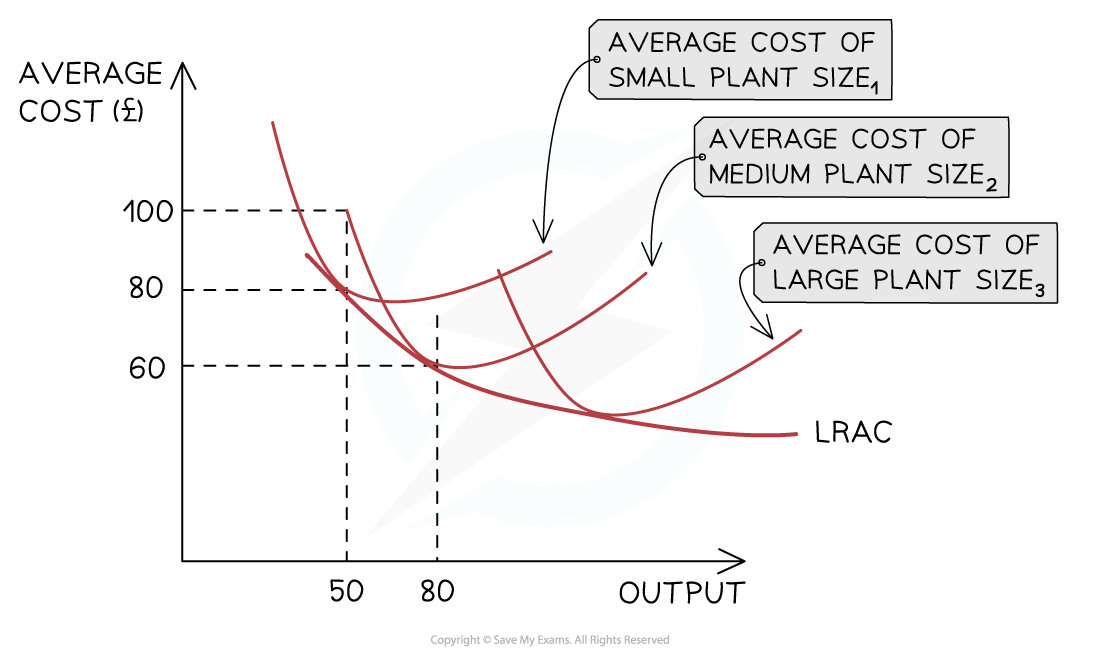
The LRAC curve is generated by the addition of successive SRAC as the firm expands its scale of production

The L-shaped Long-run Average cost Curve

  • The L-shaped long-run average cost curve is a variation of the normal long-run average cost curve and suggests that in some instances, diseconomies of scale will not cause the LRAC to turn upwards
    • In some industries, the curve may well continue to be relatively flat
  • This idea results in a loosely shaped L shaped long-run cost curve (not U-shaped)

Diagram: the L-shaped Long-run Cost Curve

screenshot-2024-02-26-at-15-54-28

In some industries, it is possible to achieve a minimum efficient scale and a firm can continue to operate at this level indefinitely

Diagram analysis

  • Assume a utility company spends $billions building out a new delivery network
  • Their average total costs (ATC) are initially very high, but fall as they are able to gain economies of scale
  • At some point, they will be operating at their lowest possible cost level (minimum efficient scale)
  • They will continue operating at this level

You've read 0 of your 0 free revision notes

Get unlimited access

to absolutely everything:

  • Downloadable PDFs
  • Unlimited Revision Notes
  • Topic Questions
  • Past Papers
  • Model Answers
  • Videos (Maths and Science)

Join the 100,000+ Students that ❤️ Save My Exams

the (exam) results speak for themselves:

Did this page help you?

Steve Vorster

Author: Steve Vorster

Steve has taught A Level, GCSE, IGCSE Business and Economics - as well as IBDP Economics and Business Management. He is an IBDP Examiner and IGCSE textbook author. His students regularly achieve 90-100% in their final exams. Steve has been the Assistant Head of Sixth Form for a school in Devon, and Head of Economics at the world's largest International school in Singapore. He loves to create resources which speed up student learning and are easily accessible by all.