Syllabus Edition

First teaching 2023

First exams 2025

|

Measurement Techniques in IB Physics (HL IB Physics)

Revision Note

Ann H

Author

Ann H

Expertise

Physics

Measurement Techniques

  • Common instruments used in Physics are:
    • Metre rules - to measure distance and length
    • Thermometers - to measure temperature
    • Measuring cylinders - to measure to volume of liquid or the volume of displaced liquid
    • Balances - to measure mass
    • Newtonmeters - to measure force
    • Protractors - to measure angles
    • Stopwatches - to measure time
    • Ammeters - to measure current
    • Voltmeters - to measure potential difference
    • Sound meter - to measure the intensity of sound
    • Light meter - to measure the intensity of light

  • More complicated instruments such as the micrometer screw gauge and Vernier calipers can be used to measure thicknesses, diameters and lengths to a greater degree of accuracy


Measuring Instruments, downloadable AS & A Level Physics revision notes

  • When using measuring instruments like these you need to ensure that you are fully aware of what each division on a scale represents
    • This is known as the resolution

  • The resolution is the smallest change in the physical quantity being measured that results in a change in the reading given by the measuring instrument
  • The smaller the change that can be measured by the instrument, the greater the degree of resolution
  • For example, a standard mercury thermometer has a resolution of 1°C whereas a typical digital thermometer will have a resolution of 0.1°C
    • The digital thermometer has a higher resolution than the mercury thermometer

          Measuring Instruments Table

Quantity Instrument Typical Resolution
Length Meter Rule 1 mm
Thickness or length Vernier Calipers 0.05 mm
Thickness or length Micrometer 0.001 mm
Mass Top-Pan Balance 0.01 g
Angle Protractor
Time Stopwatch 0.01 s
Temperature Thermometer 1 °C
Potential Difference Voltmeter 1 mV - 0.1 V
Current Ammeter 1 mA - 0.1 A

Controlling Variables

  • For an experiment to be valid, it is essential that any variable that may affect the outcome of an experiment is controlled 
  • Some of the key practical skills that are required to do so are as follows:
    • Calibration of measuring apparatus
    • Keeping certain environmental conditions constant
    • Insulation against heat loss or gain
    • Reduction of friction
    • Reduction of electrical resistance
    • Taking background radiation into account

Calibration of Measuring Apparatus

  • Calibration is a comparison between a known measurement and the measurement you achieve using the instrument
  • This checks the accuracy of the instrument, especially for higher readings
    • For example, checking whether a meter (e.g., voltmeter, micrometer, ammeter) reads zero before measurements are made
    • This helps to avoid zero error

Calibrating sensors

  • Calibration curves are used to convert measurements made on one measurement scale to another measurement scale
  • These are useful in experiments when the instruments used have outputs which are not proportional to the value they are measuring
    • For example, e.m.f and temperature (thermocouple) or resistance against temperature (thermistor)

  • The calibration curve for a thermocouple, in which the e.m.f varies with temperature, is shown below:

Calibration curve, downloadable AS & A Level Physics revision notes

A curve of voltage against temperature can be used as a temperature sensor

Maintaining Constant Conditions

  • In an experiment, a variable is any factor that could change or be changed
  • There are different types of variables within an experiment
    • The independent variable: the only variable that should be changed throughout an experiment
    • The dependent variable: the variable that is measured to determine the outcome of an experiment (the results)
    • The controlled variables: any other variables that may affect the results of the experiment that need to be controlled or monitored

  • It is essential that any variable that may affect the outcome of an experiment is controlled in order for the results to be valid and to have a fair test
    • A fair test is one in which only the independent variable has been allowed to affect the dependent variable

Controlling Heat Losses & Gains

  • Energy transfers by heating due to conduction are one of the most common sources of dissipated energy
  • To reduce energy transfers by conduction, materials with a low thermal conductivity should be used
    • Materials with low thermal conduction are called insulators
  • Insulation reduces energy transfers from both conduction and convection
  • The effectiveness of an insulator is dependent upon:

1. The thermal conductivity of the material

    • The lower the conductivity, the lower the amount of heat loss

2. The density of the material

    • The more dense the insulator, the more conduction can occur
    • In a denser material, the particles are closer together so they can transfer energy to one another more easily

3. The thickness of the material

    • The thicker the material, the lower the amount of heat loss

Cavity Wall Insulation, downloadable IGCSE & GCSE Physics revision notes

Less energy is transferred by conduction and convection if the cavity is insulated

Reducing Friction

  • In a mechanical system, there is often friction between the moving parts of the machinery
  • This results in unwanted energy transfers by heating the machinery and the surroundings
  • Friction can be reduced by:
    • Adding bearings to prevent components from directly rubbing together
    • Lubricating parts

Lubrication, downloadable IGCSE & GCSE Physics revision notes

Lubricating parts of a bicycle to reduce friction

Reducing Electrical Resistance

  • In electric circuits, there is resistance as current flows through the wires and components
  • This results in unwanted energy transfers by heating to the wires, components and the surroundings
  • Resistance can be reduced by:
    • Using components with lower resistance
    • Reducing the current 

Adjusting for Background Radiation

  • Although most background radiation is natural, a small amount of it comes from artificial sources, such as medical procedures (including X-rays)
  • Levels of background radiation can vary significantly from place to place
  • When conducting experiments to measure the radiation coming from radioactive sources, the background radiation must be taken into account, to do this:
    • Place a Geiger-Muller tube away from any radioactive sources and measure the background count
    • Carry out the experiment with the radioactive source
    • Subtract the background count from each reading to obtain the count rate from the source only

Worked example

A student measures the background radiation count in a laboratory and obtains the following readings:

Required Practical 12 WE Table 1, downloadable AS & A Level Physics revision notes

The student is trying to verify the inverse square law of gamma radiation on a sample of Radium-226. He collects the following data:

Required Practical 12 WE Table 2, downloadable AS & A Level Physics revision notes

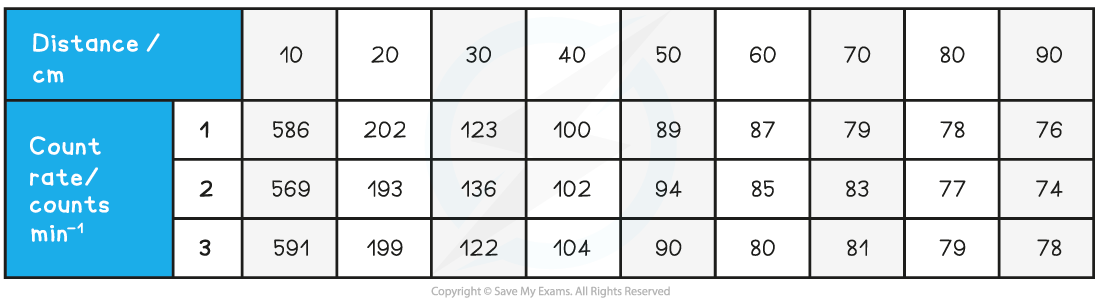
Use this data to determine if the student’s data follows an inverse square law.

Required Practical 12 Worked Example, downloadable AS & A Level Physics revision notes

Answer:

Step 1: Determine a mean value of background radiation

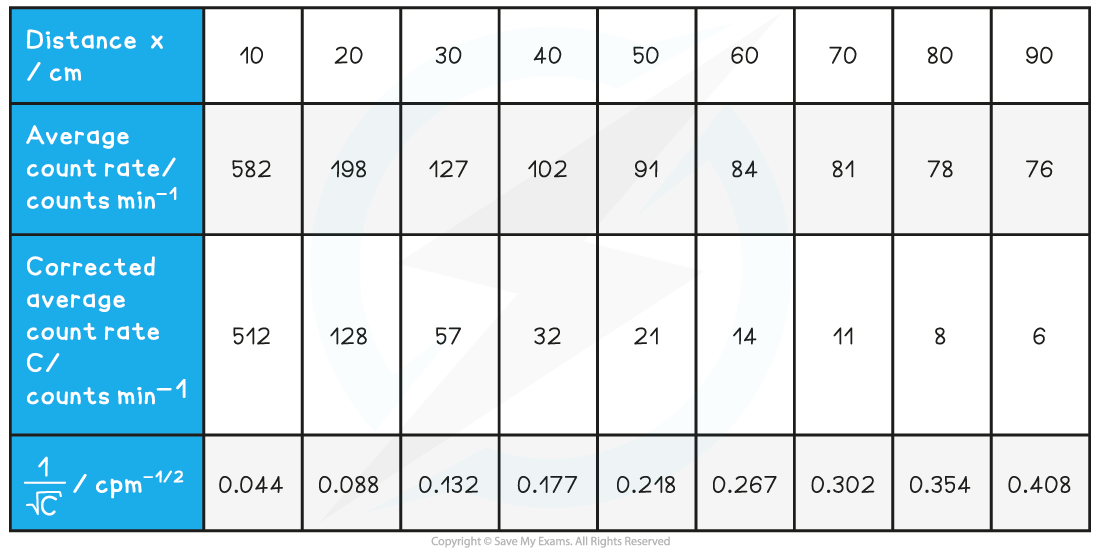
  • The background radiation must be subtracted from each count rate reading to determine the corrected count rate, C

Step 2: Compare the inverse square law to the equation of a straight line

  • According to the inverse square law, the intensity, I, of the γ radiation from a point source depends on the distance, x, from the source

Intensity Equation

  • Intensity is proportional to the corrected count rate, C, so

  • The graph provided is of the form 1/C1/2 against x
  • Comparing this to the equation of a straight line, y = mx
    • y = 1/C1/2 (counts min–1/2)
    • x = x (m)
    • Gradient = constant, k

  • If it is a straight line graph through the origin, this shows they are directly proportional, and the inverse square relationship is confirmed

Step 3: Calculate C (corrected average count rate) and C–1/2 

Required Practical 12 WE Table 3, downloadable AS & A Level Physics revision notes

Step 4: Plot a graph of C–1/2 against x and draw a line of best fit

Required Practical 12 Worked Example(1), downloadable AS & A Level Physics revision notes

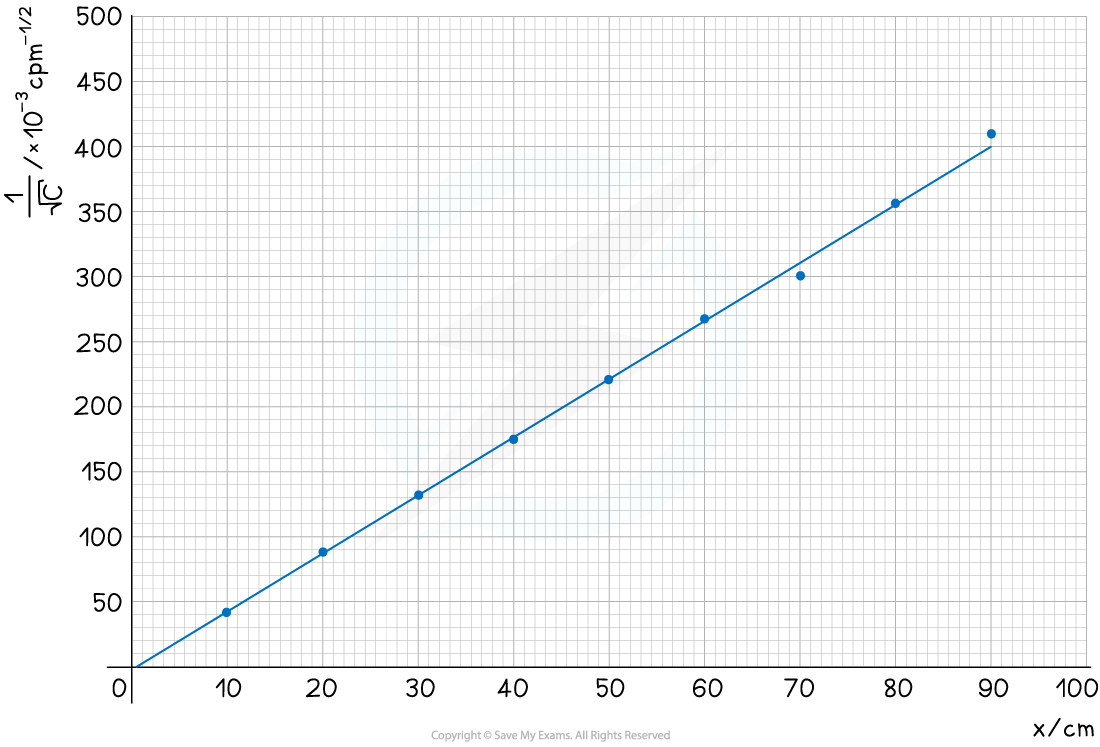
  • The graph shows C–1/2 is directly proportional to x, therefore, the data follows an inverse square law

You've read 0 of your 0 free revision notes

Get unlimited access

to absolutely everything:

  • Downloadable PDFs
  • Unlimited Revision Notes
  • Topic Questions
  • Past Papers
  • Model Answers
  • Videos (Maths and Science)

Join the 100,000+ Students that ❤️ Save My Exams

the (exam) results speak for themselves:

Did this page help you?

Ann H

Author: Ann H

Ann obtained her Maths and Physics degree from the University of Bath before completing her PGCE in Science and Maths teaching. She spent ten years teaching Maths and Physics to wonderful students from all around the world whilst living in China, Ethiopia and Nepal. Now based in beautiful Devon she is thrilled to be creating awesome Physics resources to make Physics more accessible and understandable for all students no matter their schooling or background.