1 4 marks
Explain the development of warm based glaciers.
[4]
Did this page help you?
Did this page help you?
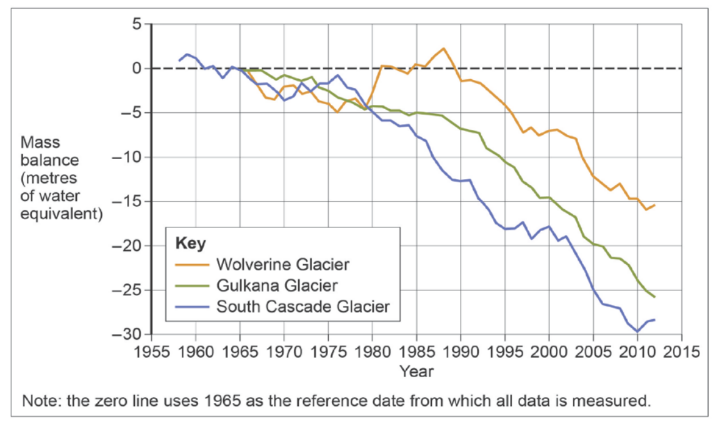
Figure 8 shows the location of three US glaciers.
Figure 9 shows the change in their size (mass balance) between 1958 and 2005.
Figure 10 shows the cumulative impact of the annual change in mass balance within the three glaciers.
Figure 8 Figure 9

Figure 10
[6]
Did this page help you?
Did this page help you?
Figure 7
The surface velocity of various glaciers, including Thwaites Glacier, Antarctica

Note: At the grounding line, glacier ice comes into contact with the sea and starts to float.
Figure 7 shows the surface velocity of various glaciers, including Thwaites Glacier, Antarctica.
[6]
Did this page help you?
[4]
Did this page help you?
Figure 7 shows the mean mass balance and cumulative mass balance for selected glaciers around the world.
Figure 7
The mean mass balance and cumulative mass balance for selected glaciers around the world

Did this page help you?
Figure 7a shows the number of days where ablation exceeds accumulation across the Greenland ice sheet between 1 January and 31 December 2017.
Figure 7b shows the number of melting days difference from the 1981–2010 average across the Greenland ice sheet between 1 January and 31 December 2017.
Figure 7c shows the percentage of the Greenland ice sheet experiencing melting in 2017. This is compared to the 1981–2010 median.
| Figure 7a – Number of days where ablation exceeded accumulation |
Figure 7b – Number of melting days difference from the 1981–2010 average |
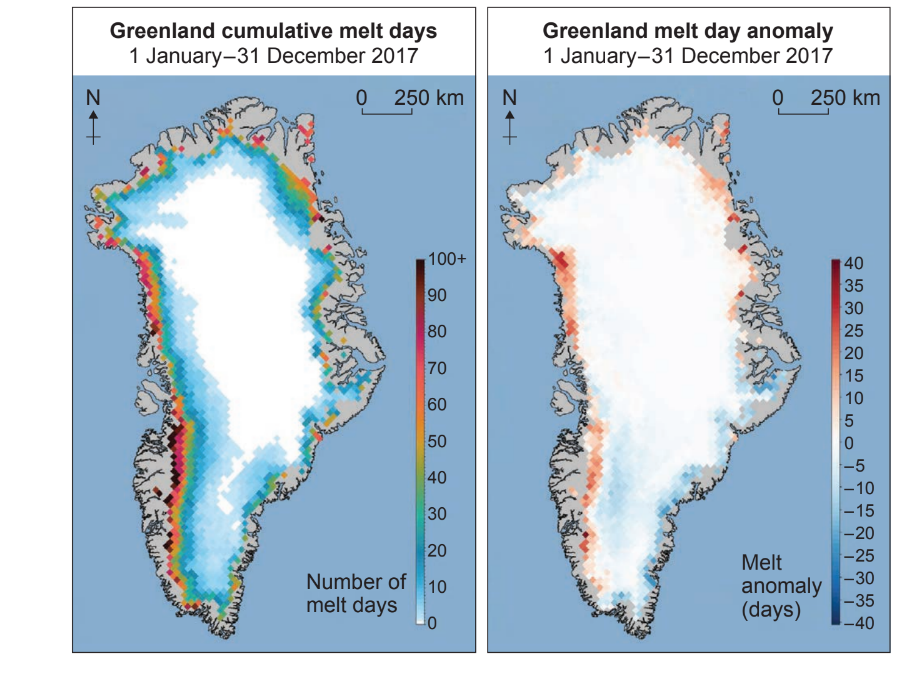
Figure 7c – Percentage of Greenland ice sheet experiencing melting
in 2017, compared to 1981–2010 median

Did this page help you?
Did this page help you?